PROJEKT NIGHTMARE
I always get terrible sleep. I dream every night; most of the dreams are bizarre, while half can be taken as nightmares. Therefore, I want to record and visualize the sleep time & quality for seven days, combining with my feelings after waking up from those dreams.
The whole project is completed by B&W only. Sleep and dreams are too terrible for me to add any color. The biggest challenge, I think, should be that I must strike a balance between objective data and subjective emotions.
Actually, I have been living with such a situation for more than fifteen years, and therapy does not work. Nightmares may accompany me as long as the memories of the past exist. Fortunately, the horrible reality has gone for years, and the only thing left now are just shadows. I know I am the only person who may cure myself, fixing the past rift by the present happiness. So, thanks for the people who love me at present.
—— Special thanks to Gia Guo, who lent me the smartwatch ——
Data Collection & Calibration
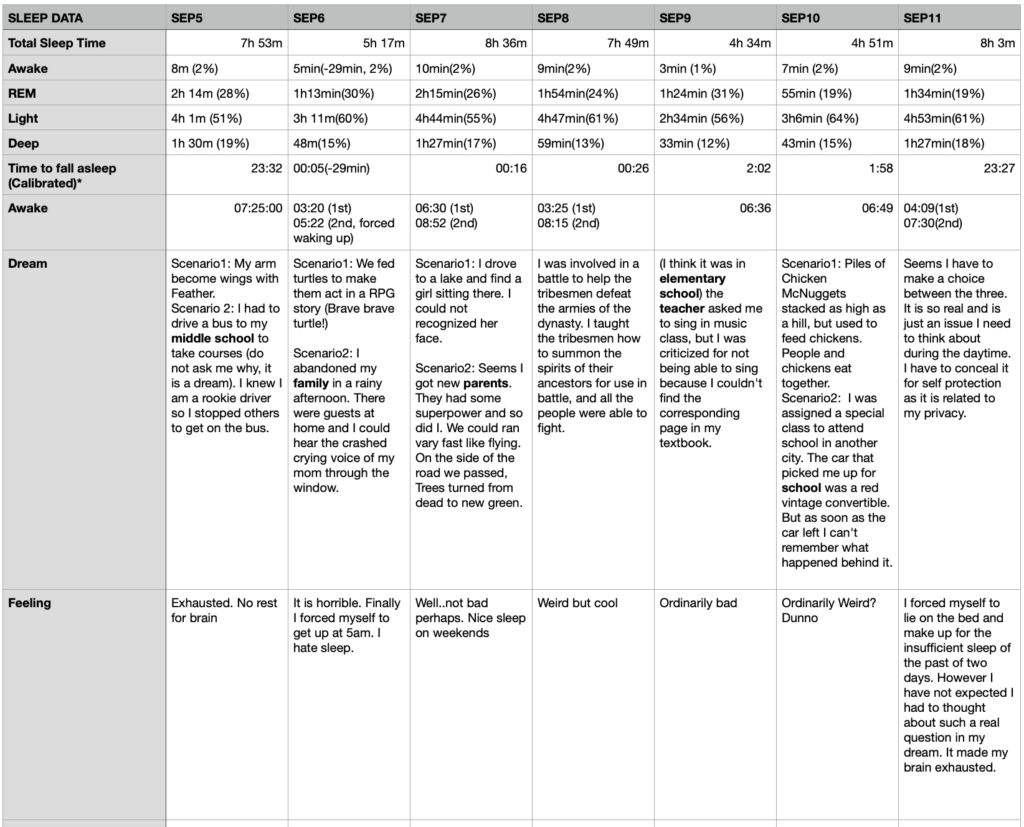
The sleep data are provided by my smartwatch, including total sleep time, light sleep, deep sleep, rapid eye movement sleep (REM), etc.
When you fall asleep at night, you usually experience 4-6 sleep cycles, each lasting an average of 60 to 90 minutes. In each cycle, the sleep stage (light sleep, deep sleep, rapid eye movement sleep) and the awake stage alternate.
Light Sleep: Light sleep is typically the first stage of falling asleep. It usually occupies about 50% of a night’s sleep.
Deep Sleep: Deep sleep is an important stage for measuring sleep quality. During deep sleep, muscles relax, breathing and heart rate are slow and stable. It usually accounts for 16–30% of an adult’s nightly sleep. Insufficient deep sleep will directly affect the body’s recovery.
Rapid Eye Movement (REM) Sleep: Characterized by rapid eye movement, increased heart rate, and muscle relaxation, REM sleep helps with brain development and learning. Most dreams occur during this period. It usually occupies 11–35% of an adult’s sleep per night.

However, the watch has a fetal issue: it cannot tell the exact time I fall asleep. For example, I usually go to bed at 23:30; however, on Sep 6th, though I did not go to bed, the watch took me as asleep and generated a lot of “Awake” data (the yellow blocks); and on Sep 9th and 10th, though I spent a lot of time to fall asleep after going to bed, I was not sure that I really fell asleep at 2am. I feel they should not be that late—maybe not too terrible these nights.
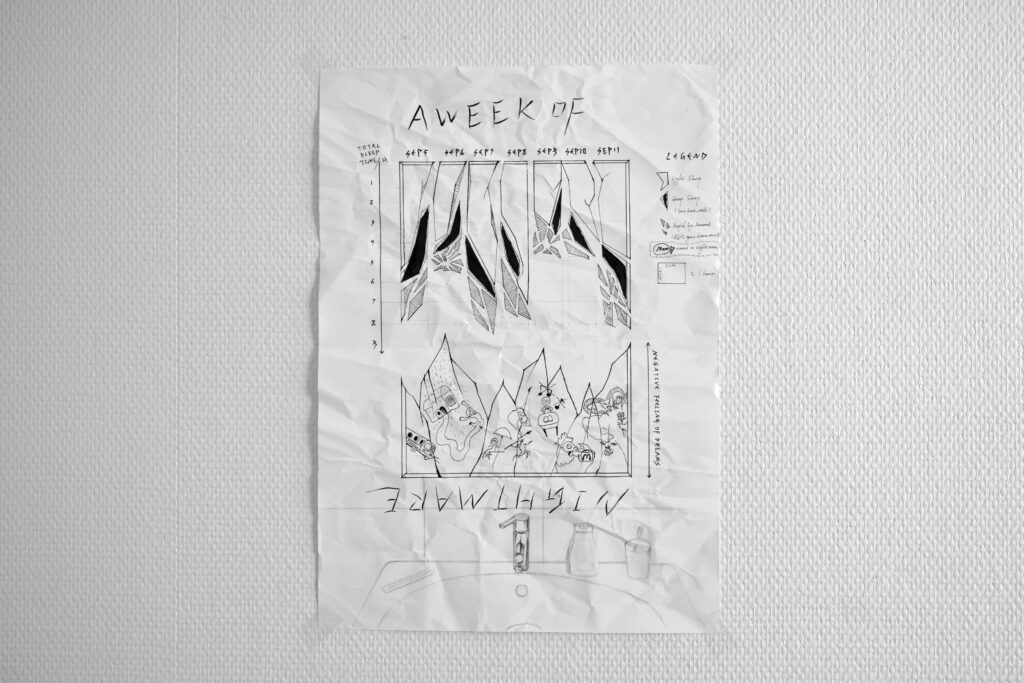
Finally, I collected and calibrated all the data and recorded all the dreams I can recall. As you can see, the keywords “school”, “parents”, and “family” show up more than once in a week, so I guess you should know what my nightmares really are.
Data Visualization
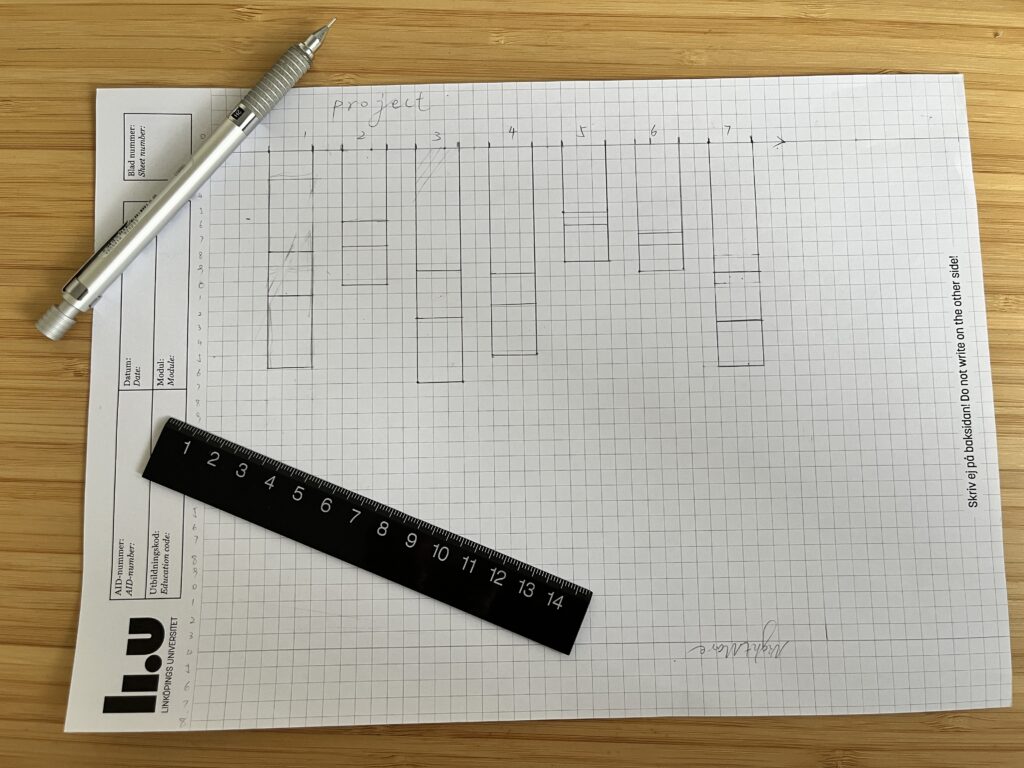
The data is visualized based on columns. Below is the draft of the first version.
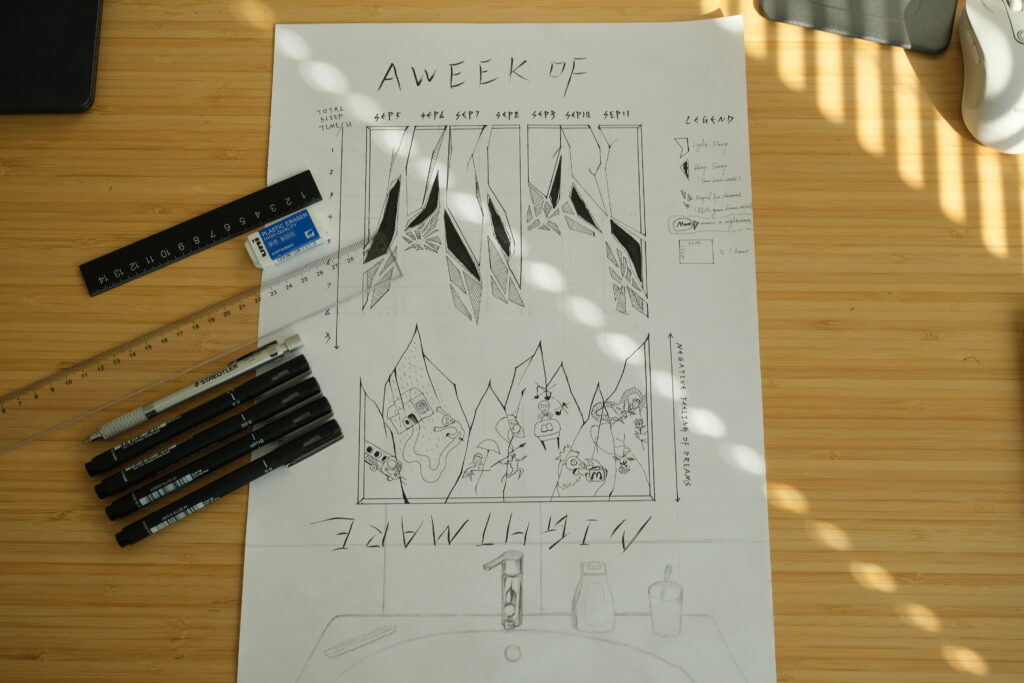
- First, make an ordinary column graph according to the calibrated data. I make the Y axis upside down to express the depression—I am falling down inside another world.
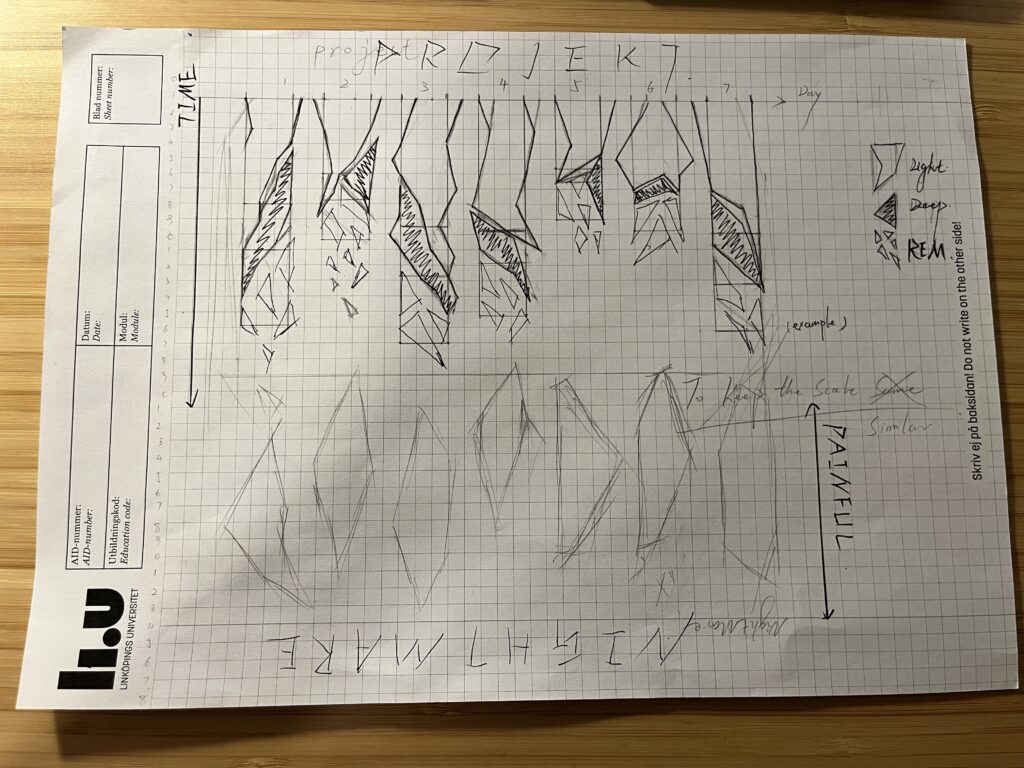
- Redistribute the area of columns. All the columns are reshaped as one part of a broken mirror. During the whole process, the scale of light/deep/REM remains the same (or to be as closed as I can); for example, if I cut down a corner on the right side, I may add one on the left with the same size.
- White for Light Sleep;
- Deep sleep is colored black;
- REM is divided into many small pieces according to the original size because this is where the dreams appear, referring to my chaotic mind. More mirror pieces a REM part has means more terrible feeling I got from the dream.
- By doing so, people can no longer tell how long each sleep period really is, but I do not think it is important. It is the conclusion rather than the number that really matters: you can still figure out which day I got insufficient sleep time, insufficient relaxation (deep sleep), and which day I got an awful dream.
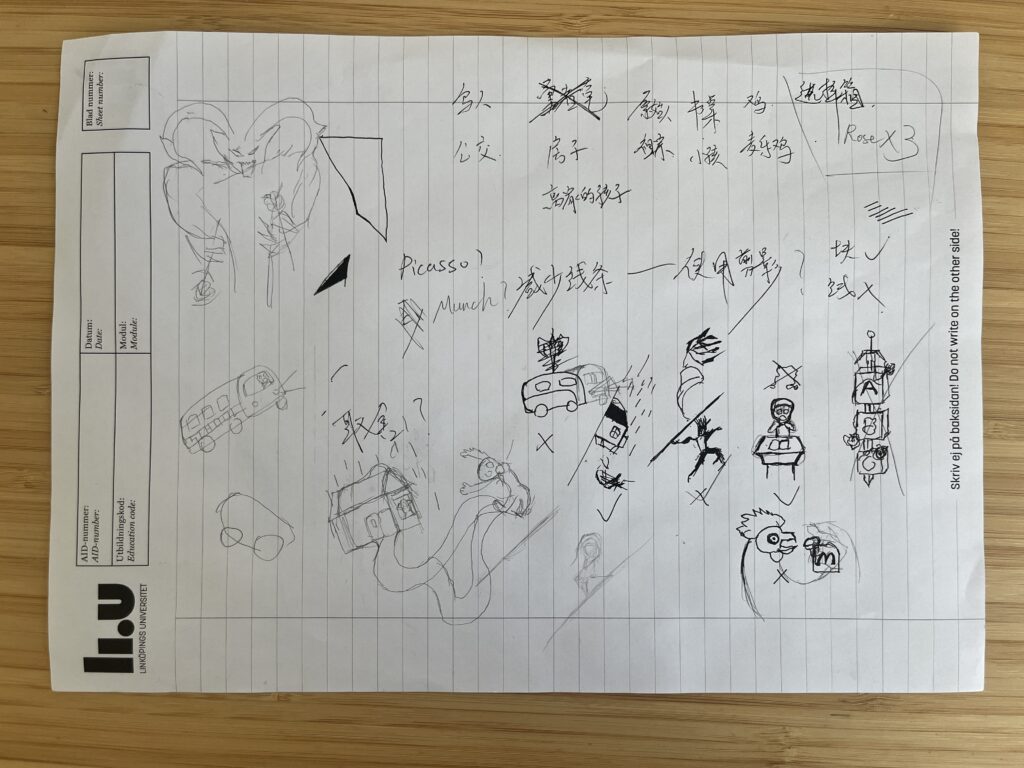
- Illustrate dreams. My original plan is to “carve” the dream story on the column, but I finally gave up. One reason is it may add noises to the data. What is more important, there is a paradox: even though I have a short sleep time, I may feel I dream for a super long time when there is a nightmare. One column can not be short and long at the same time, so I set another dimension: painful length. It is totally subjective and right opposite to the objective part. There will be huge pieces of mirrors with my dreams (by sketch) inside. The larger/longer size is related to a more painful feeling.
- My first impression of the monochrome nightmare came from Guernica by Picasso. Then I found it too difficult. Finally, I decided to do some Munch (dummy imitations, of course).
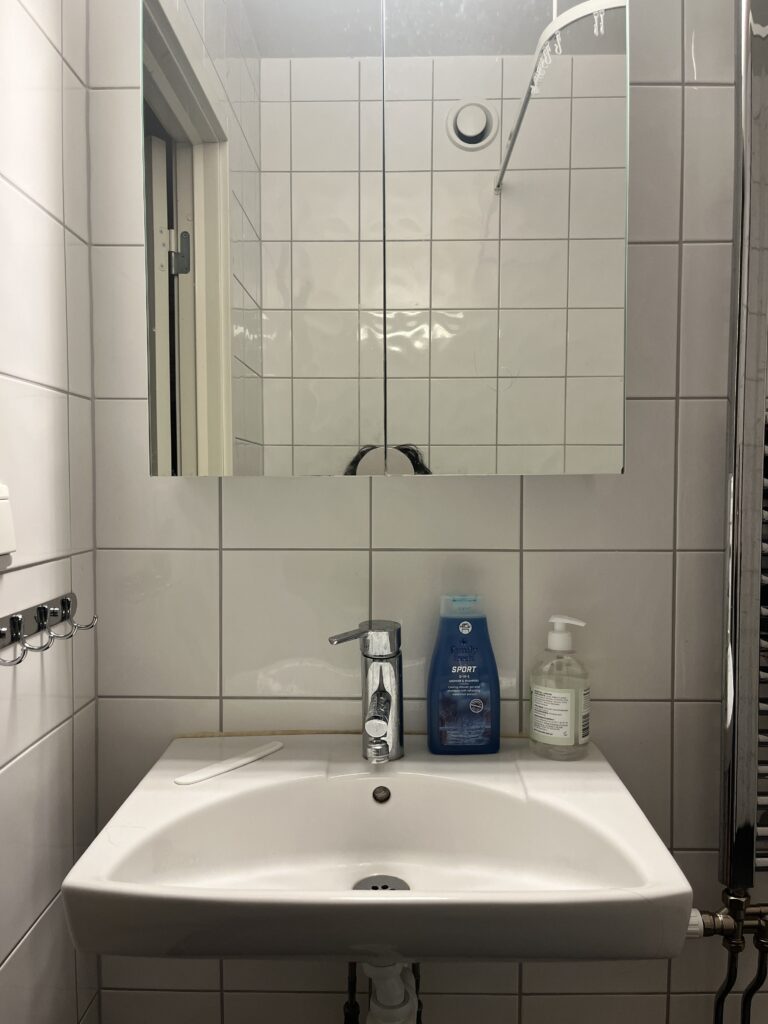
One spark at last: I made a super simple sketch of my washroom to let you know the main graph is a real mirror. It is not necessary, but I want to share such an illusion: between the dream and reality, I can see the crashed ego through the morning mirror.
Conclusion
Just as the project requirement said, the piece is a communicative act, not a scientific report. It is not 100% correct, maybe just 85%-90%, but I just want to convey my emotions or feelings to everyone who sees it. If you find them out, then I succeed.
Finally, I wish everyone a good sleep tonight.
— END —